10 Student exploration of functions and their graphs with Desmos
Ana Duff
Introduction
Desmos Graphing Calculator is an open online tool with extensive numerical and visual versatility. It allows the user to plot and label points on the Cartesian plane, demonstrate solutions to equations and inequalities, graph functions and create regression models from data sets, among other capabilities. It has a powerful built-in calculator tool and a slider tool that allows the user to create dynamic visuals exemplifying change or drawing attention to particular components.
Benefits of teaching using Desmos
- An open and free resource, without a registration or subscription requirement
- Allows static and dynamic graphic demonstrations and quantitative analysis of 2-dimensional models
- Demonstrations and activities can be pre-built
- Requires easily acquired technology skills on part of the users
- Allows easy sharing of demonstrations with other users
Resources
- Laptop or a mobile device (Android or iOS)
- Internet browser or Desmos Graphing Calculator app
Steps for Implementation
Step 1. Create an account with Desmos.com (Optional)
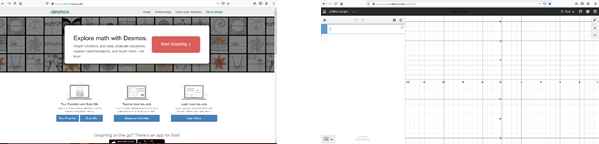
Go to Desmos.com and follow the link to Start Graphing. You have an option to create an account and to log in, which would allow you to save, name and search your work. The implementation steps that follow will be based on the assumption you are logged into your account in order to take advantage of these features. However, the graphing functionality of Desmos is not restricted to account holders, in which case one can maintain access to one’s work by creating a share link and saving it for later.
Step 2. Open the Desmos Graphing Calculator and create a graph
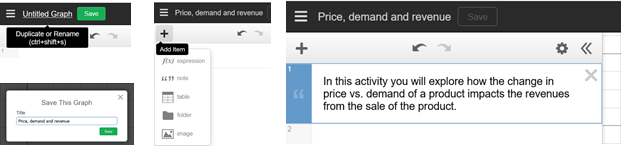
Click on Untitled Graph and enter a title for the graph (this is only available to registered users). Enter a short description of the activity: position the cursor in line 1, click on +
(Add Item), then“ ” note, and add the description inline 1.
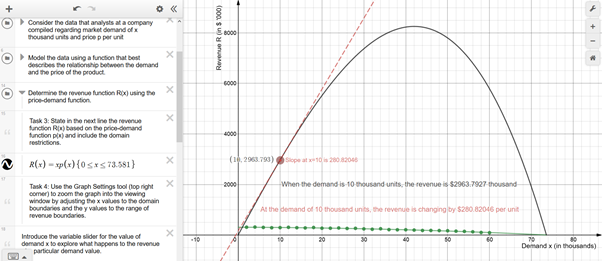
Step 3. State the function, function components or the data to be modelled by a function
Desmos allows the user to state function(s) explicitly and to model data with a function using regression. If using the activity as part of an assessment, ask students to import randomly generated data (from an Excel document, for example) so that there is variability in the resulting functions.
Step 4. Create the set of instructions
Let learning outcomes guide your set of instructions. Note that the tasks can include static and dynamic exploration of the model, including visualization of change through the slider tool. For best progression, the tasks can be organized under folders and guided by notes from the instructor built into the Desmos graph. Both can be added by clicking on
+ (Add item), then folder or note.
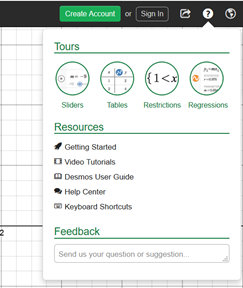
Step 4. Direct students to explore tutorials on Desmos graphing tools
The Help section provides a large bank of explicit and interactive learning resources for new and experienced Desmos users. Students can learn how to create sliders and tables, define domain and range restrictions and perform regression by following simple interactive tours provided by Desmos. The Video Tutorials library is extensive and easily searchable and the Desmos User Guide provides the basic guide on Desmos tools.
Step 5. Share the graph(s) with your students
Click on Share your graph tool located in the top-left corner. The link created will send students to the graph and let each student view and modify it separately from other users and without affecting the graph you created. Note that you can also use this tool to save the image of the graph (with some exceptions) and to embed it in other platforms.
Step 6. Incorporate Desmos Graph Calculator into assessments
Incorporate student exploration results and lessons learned into assessments through the Share Your Graph tool whereby students share the link or images of their work within, directly or as part of a separate submission document. Note that the link will include the graph as is at the time of link creation.
Dealing with Challenges
- Avoid confusion by minimizing ambiguity- Develop instructions that correspond to the activity’s learning outcomes. Break up the activity into components and organize them through folders. Direct students to specific resources as needed through the activity on topics that may need clarification. Take advantage of the vast library of “how-to” videos by Desmos and its users (accessible through any search engine with “Desmos + topic of choice”) as a resource for students on specific tasks.
- Be mindful of time and skill required – Test how long it would take you to complete the activity, then multiply the time by three. Throughout the test, reflect on your knowledge of the students, the range of their skills related to tech and content, and adjust the activity appropriately.
- Encourage problem-solving and troubleshooting through peer-to-peer support – Show students how to share work through Share Your Graph tool to seek assistance from others during the activity. Seeing the student’s work will make it easier to identify where the student made the error or reached a stumbling block.
Digital resources
Examples of exploring functions through Desmos in action:
- One-sided limits demo
- Newton’s Method example
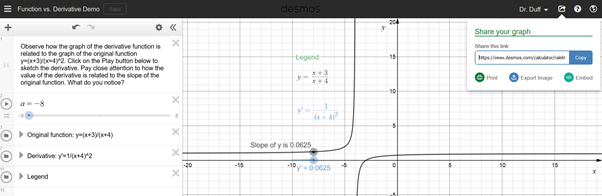
- Function vs. Derivative demo
- Modelling data using functions example
Further Reading
Ekici, Celil, and Plyley, Chris. “Inquiry-Based Modeling of Population Dynamics With Logistic Differential and Difference Equations.” PRIMUS 29.6 (2019): 553–570. Web.
Godin, Shawn. “What’s the problem? Looking for liars.” Gazette – Ontario Association for Mathematics 56.4 (2018): 11–13. Web.
Hoyles, Celia. “Transforming the Mathematical Practices of Learners and Teachers through Digital Technology.” Research in mathematics education. 20.3 1–20. Web.
Nabb, Keith, and Murawska, Jaclyn. “Motivating Calculus Through a Single Question.” PRIMUS 29.10 (2019): 1140–1153. Web.
Shahriari, Razieh et al. “The Effect of Using Technology on Students’ Understanding in Calculus and College Algebra.” ProQuest Dissertations Publishing, 2019. Web.
Author

Ana Duff is an Academic Associate with the Faculty of Business and Information Technology at Ontario Tech University where she teaches first-year courses in mathematics. Her research background is in mathematics in which she holds a Ph.D. from the University of Ottawa. Prior to Ontario Tech University, she taught mathematics at University of Ottawa, Royal Military College of Canada and International School of Belgrade in Serbia. She also has extensive experience in developing and managing large-scale community mobilization and education programs in Canada and overseas within non-government and government sectors.
